How to Set Up Uptime Monitoring (Step-by-Step for Beginners)
If you've never set up uptime monitoring before, it can sound more technical than it is. There's no code to write, nothing to install, and no server access required. If you have a URL and two minutes, you can have monitoring running.
This guide walks you through the whole process from scratch — what monitoring actually does, what to monitor first, how to configure it, and how to make sure alerts actually reach you when something breaks.
What Uptime Monitoring Actually Does
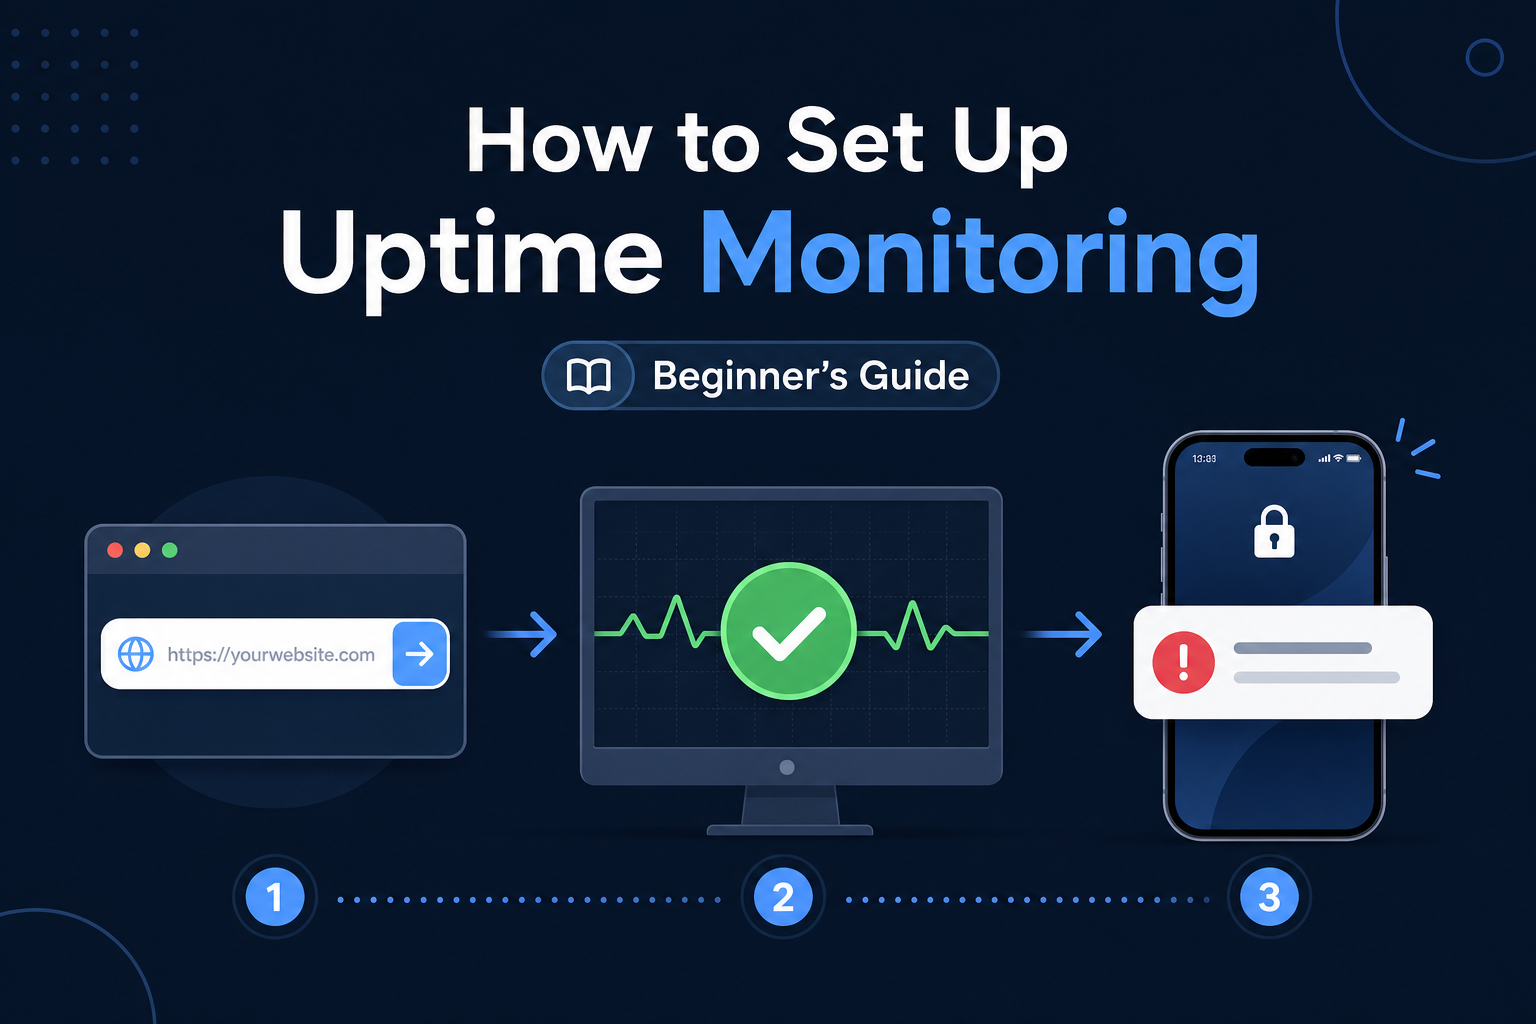
Uptime monitoring is simple at its core: a service outside your website sends a request to your site at regular intervals and checks whether it responds correctly. If it does, nothing happens. If it doesn't, you get an alert.
That's it. The monitoring service acts like a robot visitor that checks your site every few minutes, 24/7, and taps you on the shoulder the moment something's wrong.
Because the monitor runs on separate infrastructure — not on your server — it works even when your entire site is down. That's the key advantage over checking things yourself or relying on a plugin installed on your site.
Step 1: Decide What to Monitor First
Don't try to monitor everything at once. Start with the single most important URL on your site.
For most people, that's one of:
- Your homepage — the most visible page; if it's down, everyone notices
- Your main app URL — if you run a web app, the dashboard or login page
- Your most important landing page — if you're running ads or campaigns to a specific page
Pick one. You'll add more later. Starting with one monitor keeps the setup simple and lets you understand how everything works before scaling up.
Step 2: Create Your First Monitor
Setting up a monitor means giving the tool a few pieces of information. Here's what each one means:
URL — the full address you want to check, including https://. For example, https://yourdomain.com.
Check interval — how often the monitor checks your site. For your first monitor, 5 minutes is a sensible default. It catches any real outage without being aggressive.
Expected status code — the HTTP response that means "everything's fine." For almost every website, this is 200 (which means "OK"). Don't change this unless you know your endpoint returns something different.
HTTP method — leave this as GET unless you have a specific reason to change it. GET is what a browser uses to load a page.
Timeout — how long the monitor waits for a response before considering the site down. The default (usually 5-30 seconds) is fine.
In Monitoristic, you enter the URL, pick the interval, and the rest is pre-filled with sensible defaults. You can start with just the URL.
Step 3: Set Up Alerts (The Most Important Step)
A monitor that detects downtime but doesn't tell you is useless. Setting up alerts is the step people skip — and then wonder why they still find out about outages from customers.
You have two main options:
Telegram — the fastest way to get personal alerts on your phone. You connect a Telegram bot, and downtime alerts arrive as messages instantly. Free, reliable, and works anywhere you have the app. See our Telegram setup guide.
Webhooks — more flexible. A webhook sends structured data to any URL you specify, so you can route alerts to Slack, Discord, your own backend, or an automation tool. Better for teams. See our webhook guide.
For your first setup, Telegram is the easiest. You'll get a message the moment your site goes down and another when it recovers.
Don't skip this step. A monitor without alerts is just a dashboard you have to remember to check — which defeats the entire purpose.
Step 4: Verify It's Working
Once your monitor is set up, confirm everything works:
- Check the dashboard — your monitor should show as "up" with a recent check timestamp
- Test your alert channel — most tools have a "send test notification" button; use it to confirm alerts reach your phone
- Wait for a few check cycles — after 10-15 minutes, you should see a history of successful checks
If your alert test doesn't arrive, fix that now. It's much better to discover a broken alert during setup than during an actual outage.
Step 5: Add Your Other Critical Endpoints
Now that your first monitor works, add the other pages that matter. Each one gets its own monitor so you know exactly what's affected when something breaks.
Common additions:
- Login page — if users log in, a broken login blocks everyone
- Checkout / payment page — for e-commerce, this is the most revenue-critical URL
- API endpoints — if you have an API, monitor it separately from your website
- Key third-party dependencies — services you rely on, like Stripe or your database provider
For revenue-critical endpoints like checkout, consider a faster check interval (1-2 minutes) so you catch problems sooner.
Step 6: Set Up a Status Page (Optional but Recommended)
A status page is a public page where your users can check if your service is up. Instead of emailing you "is the site down?", they check the page.
This does two things:
- Reduces support load during outages
- Builds trust by being transparent about your uptime
Most monitoring tools, including Monitoristic, let you create a status page from your existing monitors in a couple of clicks.
Step 7: Configure Maintenance Windows
When you do planned work — deploying updates, migrating servers, upgrading plugins — your site might go down intentionally. Without a maintenance window, your monitor will fire false alerts and your status page will show an outage.
Setting a maintenance window tells your monitor "expect downtime during this period, don't alert." It keeps your alerts meaningful and your uptime stats accurate.
Common Beginner Mistakes to Avoid
Monitoring only the homepage. Your homepage can be up while your checkout or login is broken. Monitor each critical endpoint separately.
Skipping alerts. The #1 mistake. A monitor with no alerts is just a dashboard. Set up Telegram or webhooks immediately.
Setting the interval too long. A 30-minute check interval means a 25-minute outage could go undetected. For anything important, use 5 minutes or less.
Monitoring the wrong status code. If your page returns a 301 redirect or a 403 for unauthenticated requests, expecting a 200 will cause false alerts. Match the expected code to what your endpoint actually returns.
Forgetting maintenance windows. Deploying without a maintenance window floods you with false alerts and trains you to ignore notifications.
You're Done
That's the whole process. To recap:
- Pick your most important URL
- Create a monitor with a 5-minute interval and expected status 200
- Connect an alert channel (Telegram or webhook)
- Verify it works with a test alert
- Add your other critical endpoints
- Set up a status page
- Use maintenance windows for planned downtime
The entire thing takes a few minutes, and from that point on, you'll know about every outage the moment it happens — instead of hours later from an angry customer.